
Most RSI scalping guides teach one rule: buy when RSI crosses up through 30, sell when it crosses down through 70. It is simple, it is easy to code, and on a one-minute chart it fires constantly — including in the middle of trends where it bleeds. The five guides ranking for this keyword all repeat some version of that rule, and none of them shows a tested win rate, a break-even table, or a pass/fail list for when not to trade.
This guide does the work those guides skip. It compares the three RSI settings scalpers actually use — 7, 9 and 14 — by timeframe, gives one testable M5 pullback setup with ATR-scaled stops, and prices every trade before the entry rules appear. The winning edge in one sentence: exact RSI settings by timeframe, a pullback setup a stranger could paper-trade from the rules alone, and the cost math that decides whether the setup is worth trading at all.
An RSI scalping strategy uses a 7–14 period Relative Strength Index on the 1- and 5-minute charts to time entries with the short-term trend. The main setup is the M5 pullback: price above the 50 EMA, RSI dips into the 40–55 zone and turns back up, and the entry triggers on the first M5 close back above the 9 EMA.
Key takeaways
- RSI has three scalping uses, not one: the 50-midline cross, the 40–60 pullback zone, and the 70/30 extremes. Each fails in a different market, so the setup must name which one it trades.
- RSI 14 on M5 is the learning setup. RSI 7 on M1 is faster and noisier, and the cost table shows why the smaller M1 targets matter.
- A 0.7-pip round-trip cost on an 8-pip stop needs a 43.5% win rate to break even at 1.5R, but 57% at 1R on M1. Target size, not the entry rule, decides whether the trade is worth taking.
- The pullback setup only trades when five filters pass: trend, EMA separation, RSI zone, ATR floor, spread cap. A failed filter is a skipped trade.
- None of the five ranking guides shows a backtest or a tested win rate. This setup is rules-based and untested — paper-trade it for 30 trades before risking real capital.
What RSI is, and the three ways scalpers use it
The Relative Strength Index measures the speed of recent price changes on a 0–100 scale. Wilder's original 14-period setting smooths 14 candles of gains against 14 candles of losses. A shorter period reacts faster and whipsaws more; a longer period is smoother and later. That trade-off — speed against noise — is why no single RSI period is "best" for every timeframe.
Scalpers use RSI in three distinct ways, and the ranking guides disagree with each other because each one quietly picks a different use:
- The 50-midline cross (momentum). RSI crossing back above 50 after dipping below it means momentum is turning up — the fastest trigger, and the one FXNX's top-ranked guide builds on. It works in trends and fails in ranges, where RSI crosses 50 every few candles.
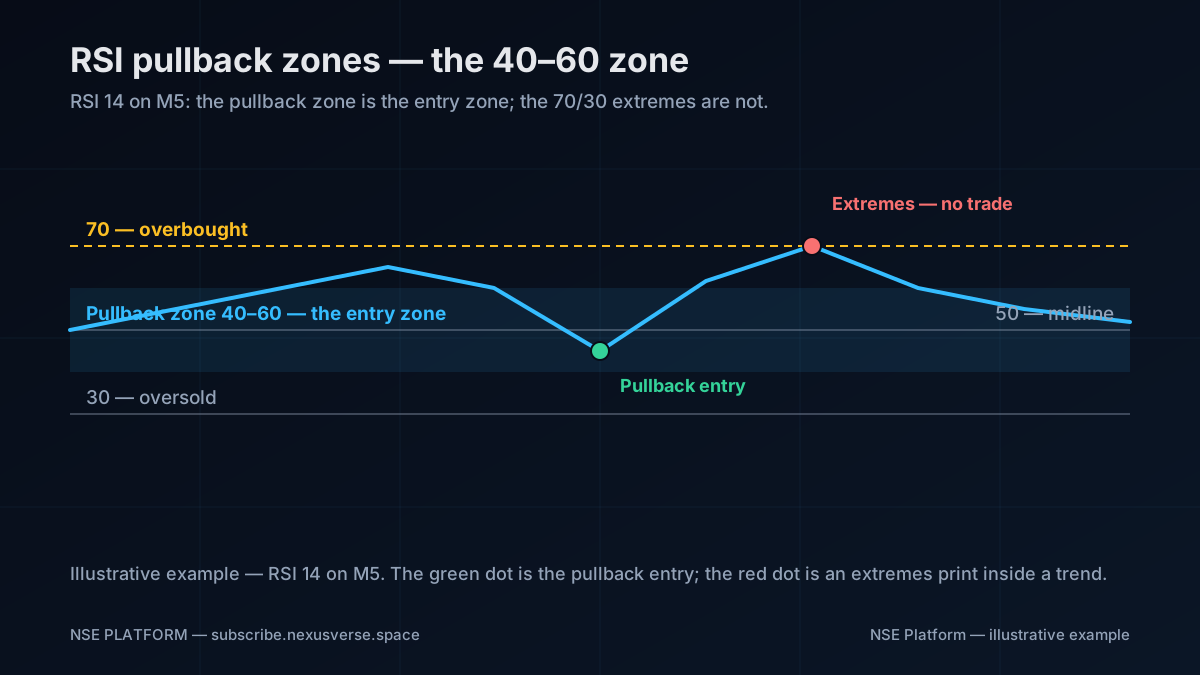
- The pullback zone (trend entries). In an uptrend, RSI pulls back to 40–55 and turns up again — the dip is the entry. AppTrading's guide uses this version (longs 40–55, shorts 45–60). This is the setup this guide teaches, because it trades with the trend instead of against it.
- The 70/30 extremes (reversals). RSI above 70 means overbought, below 30 oversold — so the classic rule sells the top and buys the bottom. In a strong trend, RSI can sit above 70 for an entire London session while price keeps climbing. HW.online recommends RSI 7 with the 30/70 cross; TradingView's broker page uses RSI 7 with 80/20 extremes on M1. The extremes version hurts beginners most, because it fights the trend by design.
RSI settings by timeframe
| Setting | Best timeframe | What it is for | Weakness |
|---|---|---|---|
| RSI 7 | M1 | Fast extremes and 80/20 reversals | Noisiest — false signals in chop; needs the strictest filters |
| RSI 9 | M1/M5 | Momentum — 50-midline crosses | Late on reversals, early on pullbacks; a compromise, not a specialist |
| RSI 14 | M5 | Pullback entries in the 40–60 zone | Slowest — misses the first leg of a fast move |
| RSI 14 | M15 | Gold (XAUUSD) pullbacks | Gold's spread needs wider targets; M5 RSI 14 fires too often |
Two rules follow. Learn the setup on RSI 14 and M5, where the cost math works, before touching RSI 7 on M1. And never run two RSI periods on one chart and take whichever signal fires first — that is two systems competing for your capital, not confirmation.
The cost math first
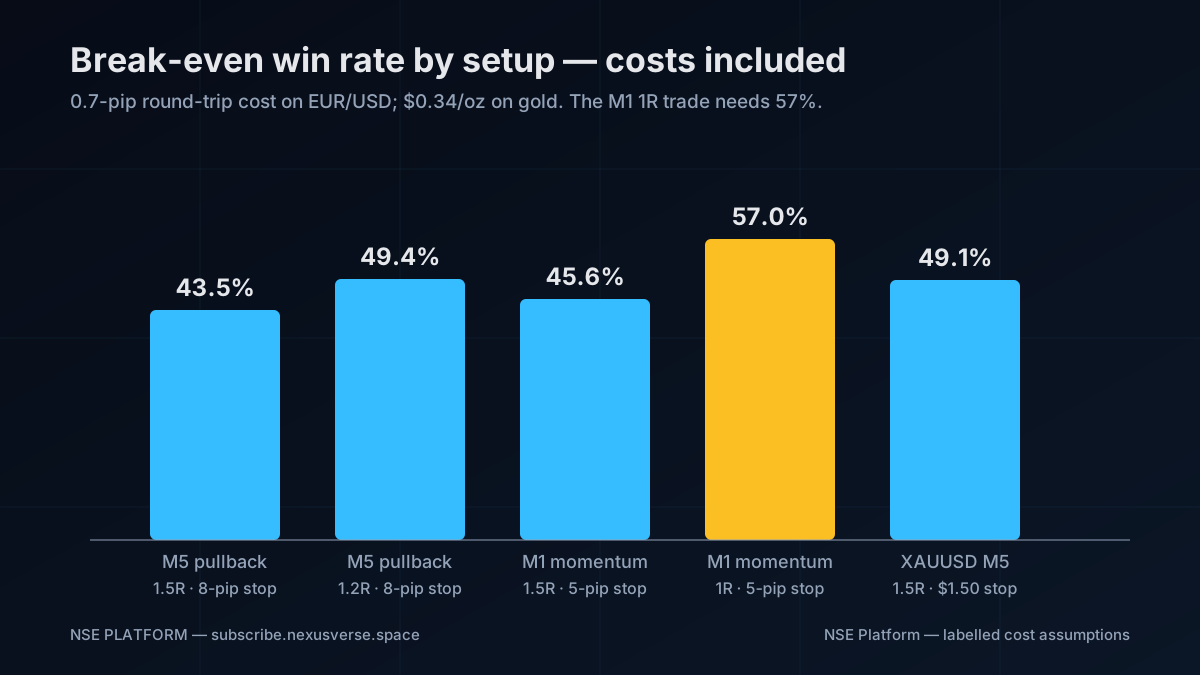
An RSI scalp is a small-target trade, and small targets die on costs. Labelled assumptions for a typical ECN-style account: round-trip cost is spread plus commission — 0.3 pip spread + 0.4 pip commission on EUR/USD, and $0.30 spread + $0.35 commission per 0.1 lot on gold (about $0.34 per ounce). Break-even win rate is net loss divided by net win plus net loss, after costs.
| Setup | Stop | Target | Round-trip cost | Cost as % of target | Break-even win rate |
|---|---|---|---|---|---|
| EUR/USD M5 pullback, 1.5R | 8 pips | 12 pips | 0.7 pip | 5.8% | 43.5% |
| EUR/USD M5 pullback, 1.2R | 8 pips | 9.6 pips | 0.7 pip | 7.3% | 49.4% |
| EUR/USD M1 momentum, 1.5R | 5 pips | 7.5 pips | 0.7 pip | 9.3% | 45.6% |
| EUR/USD M1 momentum, 1R | 5 pips | 5 pips | 0.7 pip | 14.0% | 57.0% |
| XAUUSD M5 pullback, 1.5R | $1.50 | $2.25 | $0.34 | 15.1% | 49.1% |
Three conclusions. First, the M5 pullback at 1.5R is the cheapest trade on the table — 43.5% breaks even. Second, the M1 trade at 1R is a donation: the same 0.7-pip cost needs 57% to break even, and no RSI rule tested in public shows that edge. Third, gold needs wider targets: a $2.25 target still needs 49.1%. If your target cannot carry the cost, no RSI setting saves you.
The setup: M5 RSI pullback, step by step
Timeframe hierarchy: H1 for bias (is the day trending, and which way?), M5 for structure and the trigger. Learn the setup on M5 before touching M1.
Indicators: RSI 14, EMA 9 and EMA 50, ATR(14) on M5. Nothing else. The 50 EMA is the trend filter; the 9 EMA is the trigger line.
Pairs and sessions: EUR/USD and GBP/USD in London (07:00–10:00 GMT) and the London–New York overlap (13:00–17:00 GMT). XAUUSD on M15 in the same windows. Never trade the pullback in Asia: RSI sits in the 40–60 zone for hours there, and the "pullback" is usually the first touch of a range that will chop you.
The rules:
- Confirm the trend. Price is above a rising 50 EMA on M5 for longs; below a falling one for shorts, with higher highs and higher lows to confirm. If price is tangled around the 50 EMA, there is no trend — and no trade.
- Check EMA separation. The 9 EMA must sit at least 3 pips from the 50 EMA on EUR/USD (about 0.6 ATR). If the two EMAs are touching, the trend is too weak to pull back from.
- Wait for the pullback. Price dips toward the 9 EMA and RSI 14 falls into the 40–55 zone for longs (45–60 for shorts). RSI must not cross below 40 on a long — below 40, the pullback is becoming a reversal.
- Enter on the trigger. The first M5 candle that closes back above the 9 EMA (for longs) with RSI turning up out of the zone is the entry, on the open of the next candle. Never enter on a candle that is still forming — the close is the confirmation.
- Stop: 0.5 × ATR(14) on M5 beyond the pullback low — 2.5 pips beyond the low when ATR reads 5 pips. Never a fixed pip stop: volatility changes through the session.
- Target: 1.5R, or the previous session high/low if that is closer. Take the whole position off — partials on a 1.5R trade are a second trade you did not plan.
- Risk 0.25%–0.50% per trade. Daily loss limit 2%. Three losses in a row: stop for the session.
The M1 variant, for later: RSI 9 on M1, same rules, pullback zone 35–55, 5-pip stop, 1.5R target. It needs 45.6% to break even — tradeable only with the same filters, and only after 30 paper trades on M5.
Worked example — EUR/USD, London session
Example — not live prices. Assumptions are labelled so you can check the arithmetic.
Account $10,000, risk 0.5% = $50. EUR/USD, London 08:40 GMT. ATR(14) on M5 reads 5 pips; the 50 EMA is rising with price above it; the 9 EMA sits 4 pips above the 50 EMA.
Price pulls back from 1.1045 toward the 9 EMA. RSI 14 dips to 42, then turns up, and the next M5 candle closes back above the 9 EMA at 1.1030. Entry 1.1030. The pullback low is 1.1022, so the stop is 1.1019 (0.5 ATR below the low) — 11 pips. Target 1.5 × 11 = 16.5 pips → 1.1046, before the previous session high at 1.1055.
Position size: lot size = dollar risk ÷ (stop distance × pip value). Pip value is $10 per 1.0 lot on EUR/USD. Lot size = $50 ÷ (11 × $10) = $50 ÷ $110 = 0.45 lots. Round down to 0.45.
Cost check: net win = 16.5 − 0.7 = 15.8 pips; net loss = 11 + 0.7 = 11.7 pips. Break-even = 11.7 ÷ 27.5 = 42.5%. Worth taking above 42.5% — and only if all five filters passed and the spread was under the 0.5-pip cap.
When NOT to trade the RSI pullback
- RSI is flat in the 40–60 zone. In Asia and in chop, RSI lives in the pullback zone for hours. A zone reading with no trend is noise, not a setup.
- The EMAs are tangled. 9 EMA within 3 pips of the 50 EMA means the trend is undecided. Wait for separation or stand aside.
- ATR is collapsing. ATR(14) on M5 under 2 pips on EUR/USD means the market is asleep. The pullback will print a 3-pip target and the spread will eat it.
- Spread above the cap. Do not scalp EUR/USD if your spread is above 0.5 pips. Around red-folder releases it widens past 1 pip — stand down for 30 minutes either side.
- Before scheduled news. Never hold an RSI pullback through CPI, NFP, FOMC or retail sales — the spike reprices every level. See our US retail sales scalping plan for the release-day rules.
- After three losses. Three consecutive losses means the read on the session is wrong, not the setup. Stop for the session — the fourth trade is revenge, not a pullback.
Five mistakes and the fixes
- Buying every RSI dip below 30. Fix: below 30 in a downtrend is momentum, not value. The pullback zone is 40–55 in an uptrend; below 40, the trade is off.
- Two RSI periods, one chart. Fix: one setting per session. RSI 7 and RSI 14 firing together is two systems, not confirmation.
- Entering before the candle closes. Fix: the close is the confirmation. An RSI that turns up mid-candle can turn back down before the close.
- Fixed-pip stops. Fix: 0.5 ATR beyond the pullback low. A 5-pip stop is too wide for EUR/CHF in Asia and too tight for GBP/JPY at the London open.
- No cost check. Fix: run the break-even table before the session. If the target cannot carry the cost, the setup does not exist today.
Frequently asked questions
What is the best RSI setting for scalping?
RSI 14 on M5 is the best starting setting, used for pullback entries in the 40–60 zone with a 50 EMA trend filter. RSI 9 suits M1 momentum trading, and RSI 7 suits fast M1 extremes — but both are noisier and need stricter filters. The period must match the timeframe and the use, and the cost table decides whether the trade is worth taking at all.
Is RSI 7 or 14 better for scalping?
RSI 14 is better for learning and for M5 pullbacks, because it filters out the chop that RSI 7 trades into. RSI 7 is better only for fast M1 extremes trading, where speed matters more than smoothness — and it produces far more false signals, so it needs a spread cap, an ATR floor, and a trend filter to survive.
Does RSI work for scalping?
RSI works as a timing tool inside a trend, not as a standalone signal. The pullback setup — trend filter, RSI dip into 40–55, entry on the close back above the 9 EMA — gives testable rules. The classic 70/30 reversal rule fails in trends, where RSI can stay overbought for a whole session. No ranking guide for this keyword shows a backtest, so treat any claimed win rate as unproven and paper-trade the rules first.
How do you avoid false RSI signals on M1?
Four filters cut most M1 false signals: trade only with the 50 EMA trend, require EMA separation of at least 3 pips, require ATR(14) above 2 pips on EUR/USD, and cap the spread at 0.5 pips. Skip the trade if any filter fails, and never enter before the M1 candle closes. Even with all four, M1 needs a 45.6% win rate at 1.5R to break even after costs.
What is the best timeframe for RSI scalping?
M5 is the best timeframe to learn RSI scalping, with M15 for gold. M1 doubles the break-even pressure for the same setup because the spread is the same while the target is half the size.
Related reading
- Best Indicators for Scalping: The Core 3 Setup for M1 and M5 — RSI 14 alongside EMA 9/21 and ATR in the core setup this guide builds on.
- ATR Position Sizing for Scalping — the full ATR sizing formula behind the 0.5 ATR stop and the position-size division.
- 1-Minute vs 5-Minute Scalping: Which Timeframe Pays After Costs? — why M5 beats M1 on the cost table.
- VWAP Scalping Strategy: Session VWAP Bounces on M5 — the other M5 pullback setup, graded by VWAP instead of RSI.
Sources consulted
- RSI Scalping: The Setting Most Traders Get Wrong — FXNX
- 5 Minute Scalping Strategy With EMA and RSI — AppTrading
- Forex Scalping Strategy for Beginners — InsightfulTrade
Educational material only — not financial advice. Forex and gold trading with leverage can produce substantial losses. Backtest and demo-trade any setup before risking real capital.